Product Design at LinkedIn Ads
As a Product Design Lead on LinkedIn’s Marketing Solutions team, I owned the strategy and design of how advertisers measure and act on campaign performance in Campaign Manager. My work spanned three areas: advertiser reporting and measurement, featured below; a 0-to-1 incentives experience for new advertisers, where in-product delivery performed 9x better than email; and design standards across the broader Ads organization.
Campaign Performance
Overview: Advertisers couldn’t tell whether their campaigns were working. The reporting table was data-heavy and hard to interpret, and it drove the majority of top customer complaints. I designed a performance report that turns that data into clear insights advertisers can act on.
Role: Design lead. I co-wrote the strategy with the PM, set the design vision, and led the work end to end, partnering with four PMs, research, engineering, and our design director.
Impact: 54% adoption after launch · 68.5% engagement with insights and optimization actions · $3.2M influenced revenue
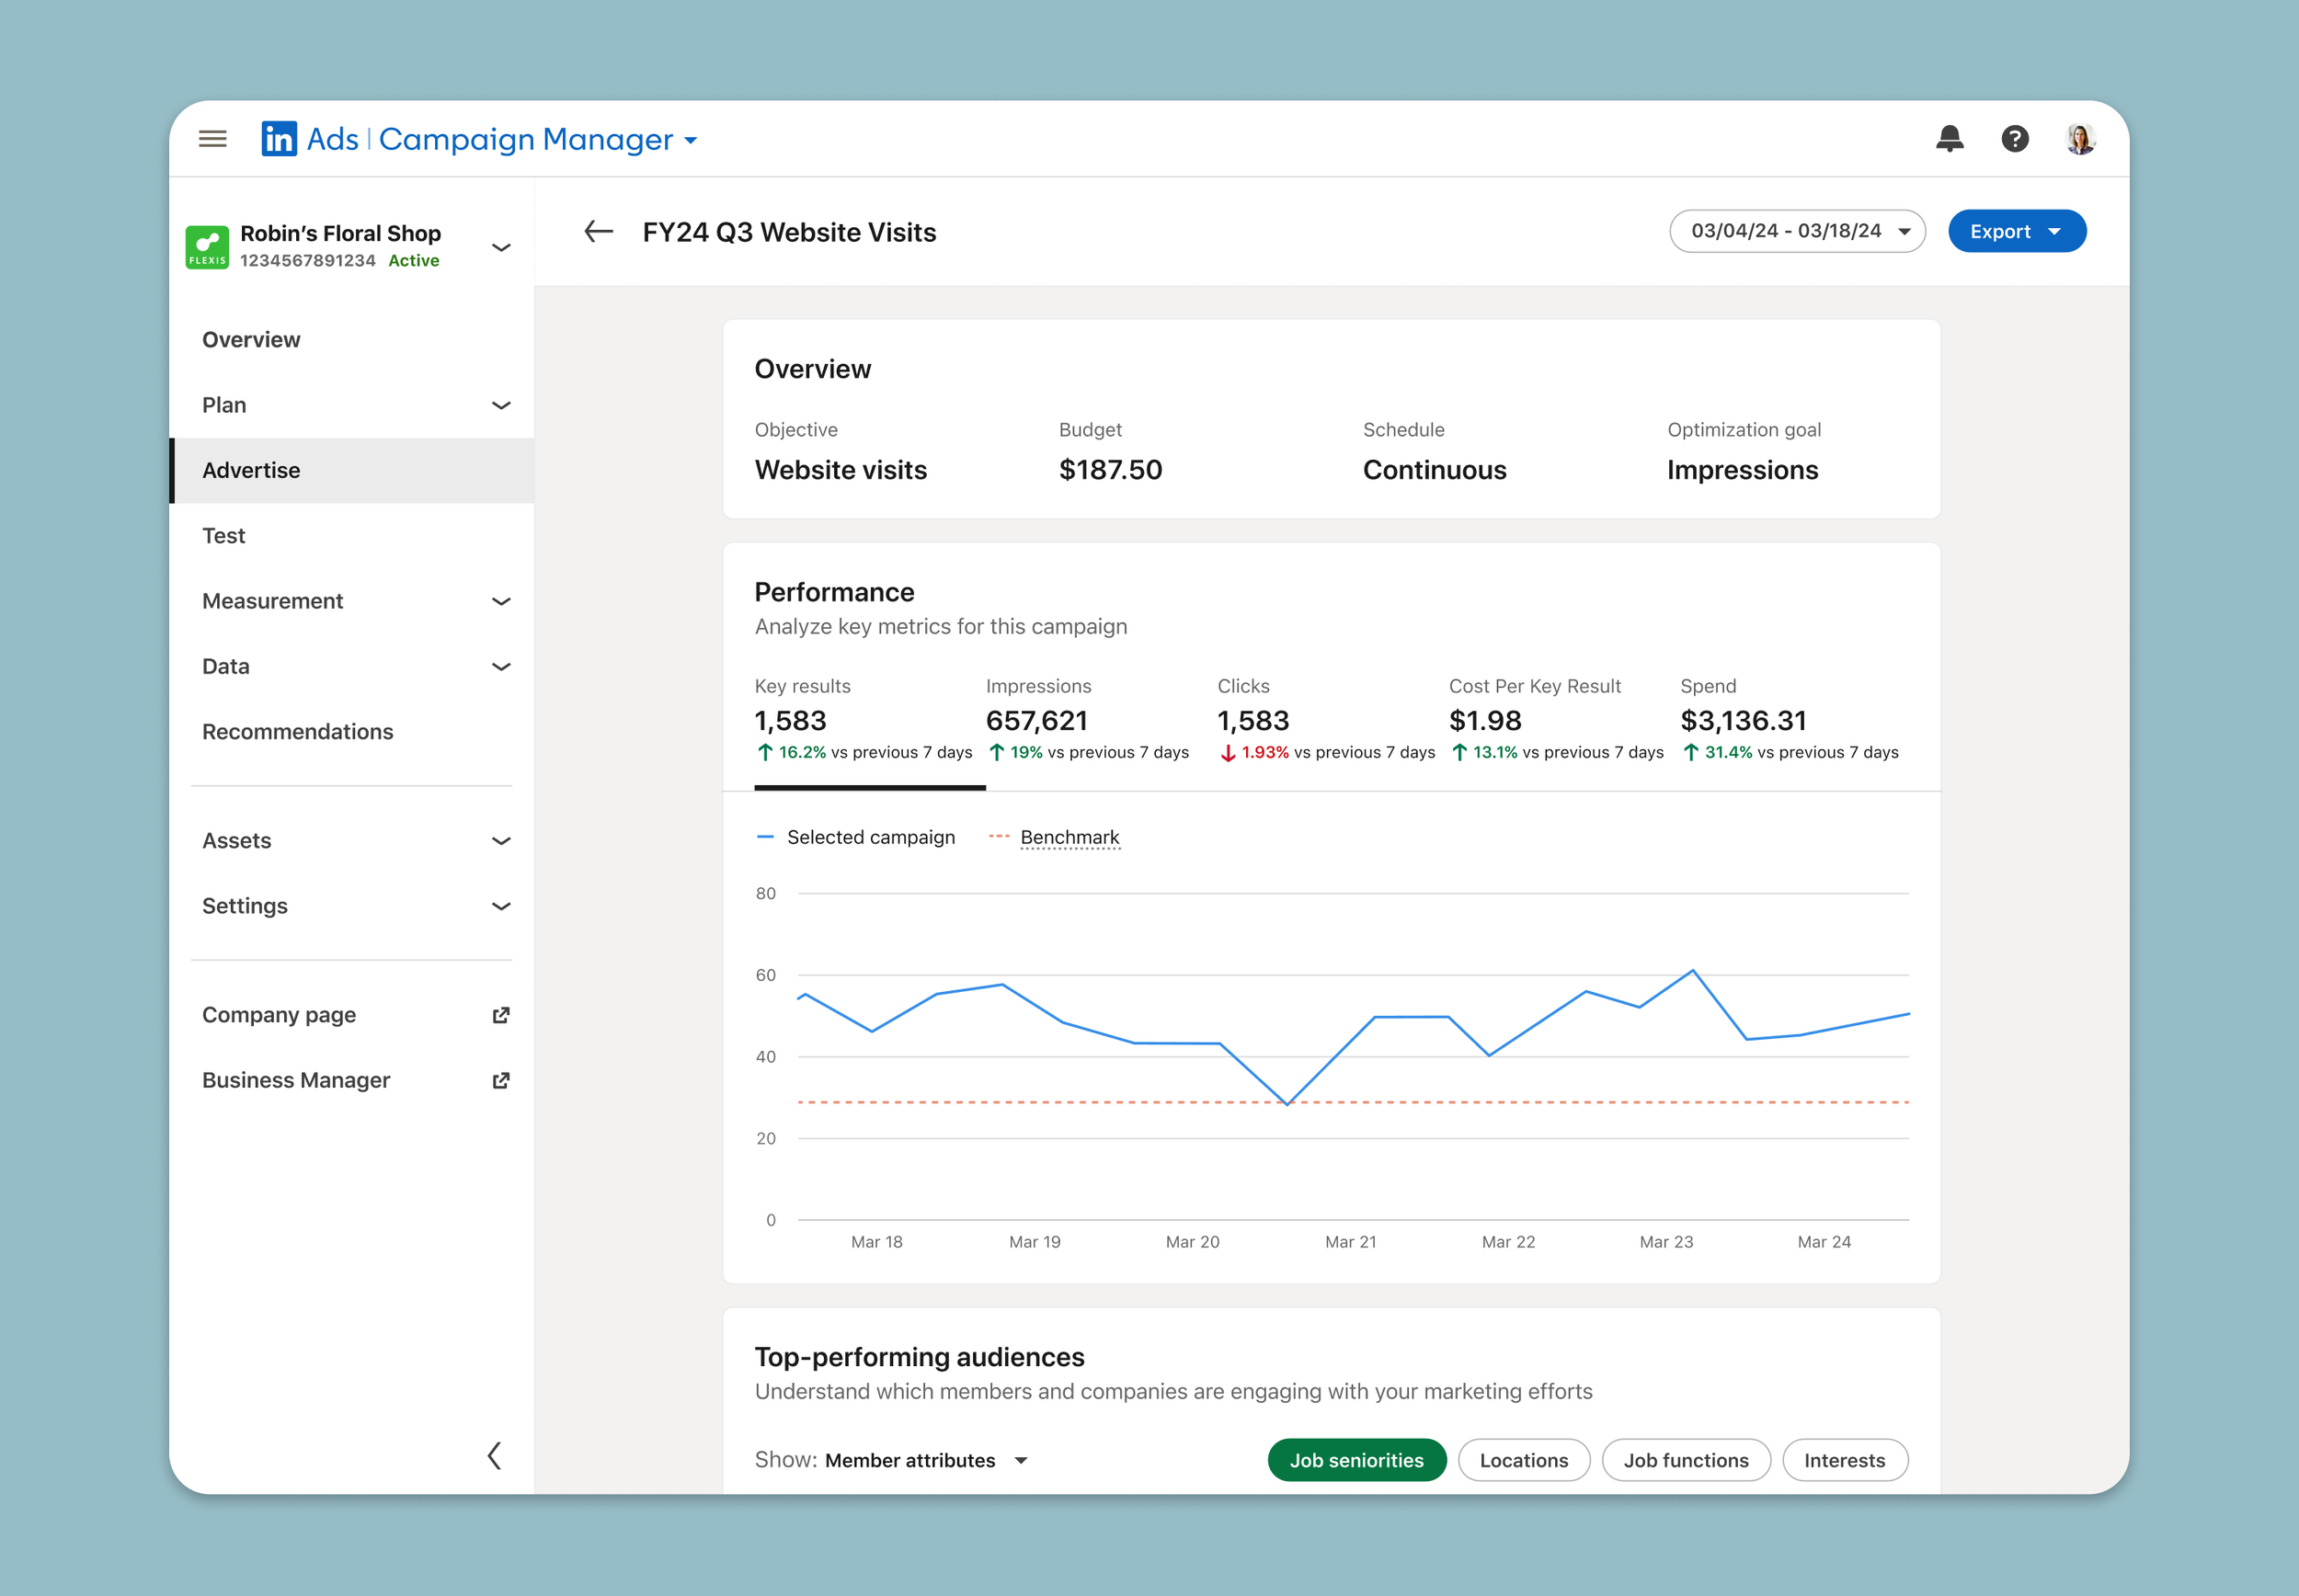
How I approached it
Found where advertisers got stuck: I led workshops to map the advertiser journey from creating a campaign to checking results. The drop-off was always at reporting. The table showed every number but couldn’t answer three questions: is this working, who is it reaching, and what should I change?
Designed around a click that already existed: Advertisers were already clicking the campaign name and expecting something to happen. Instead of changing a table they relied on, I designed a new report behind that click, ordered the way they ask: performance against a benchmark first, then audience, then content.
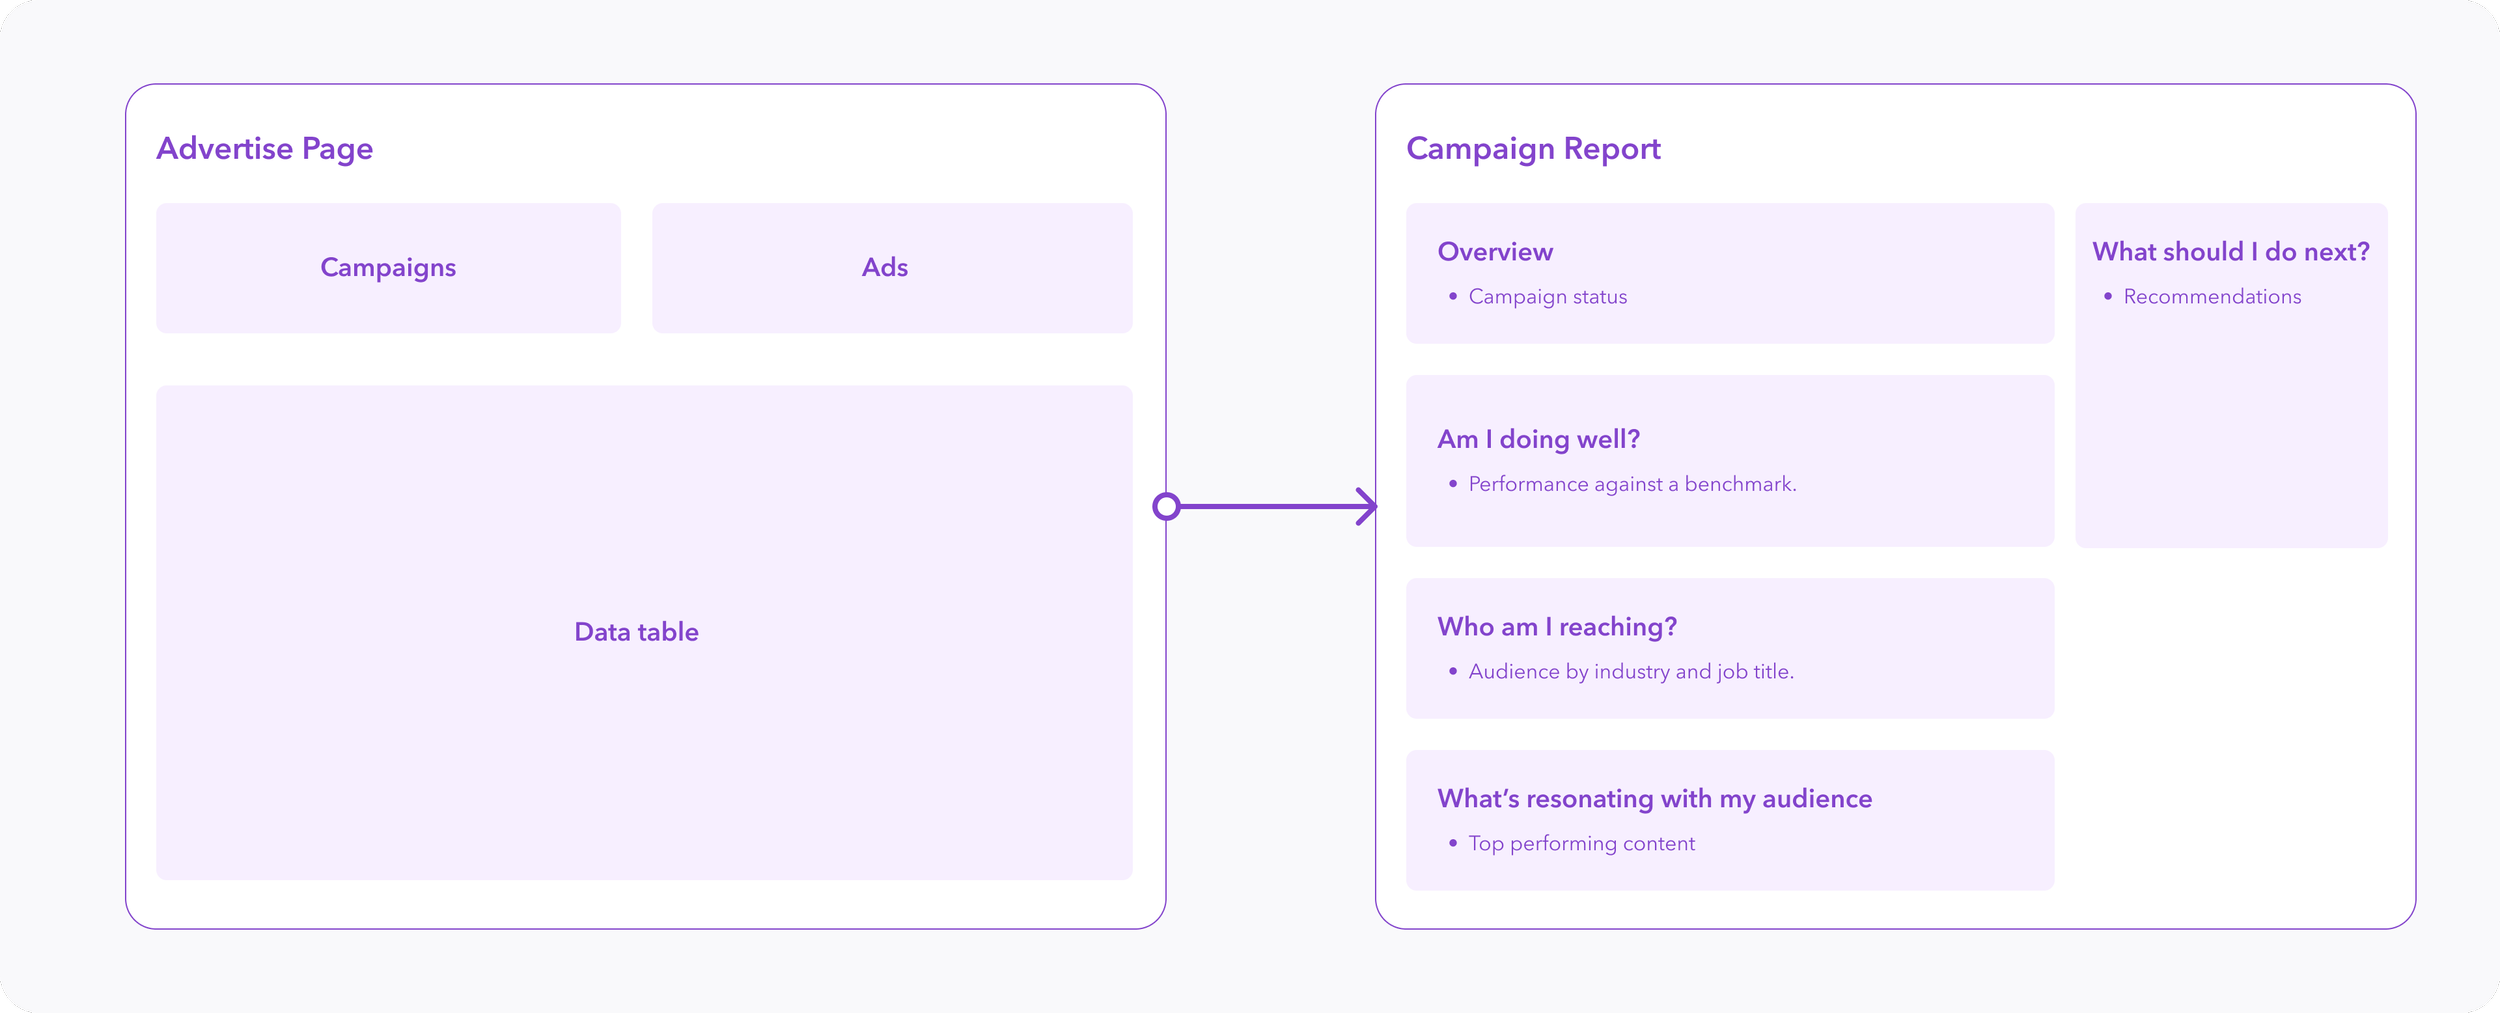
Brainstorm — how I structured the report
Defining the right surface with engineering
I explored a modal, a side panel, and a dedicated page. The side panel was my preference, but the table ran on Ember and the report needed to be React, so nesting it would have been fragile and expensive. A dedicated page was cleaner to build and gave the report room to grow.
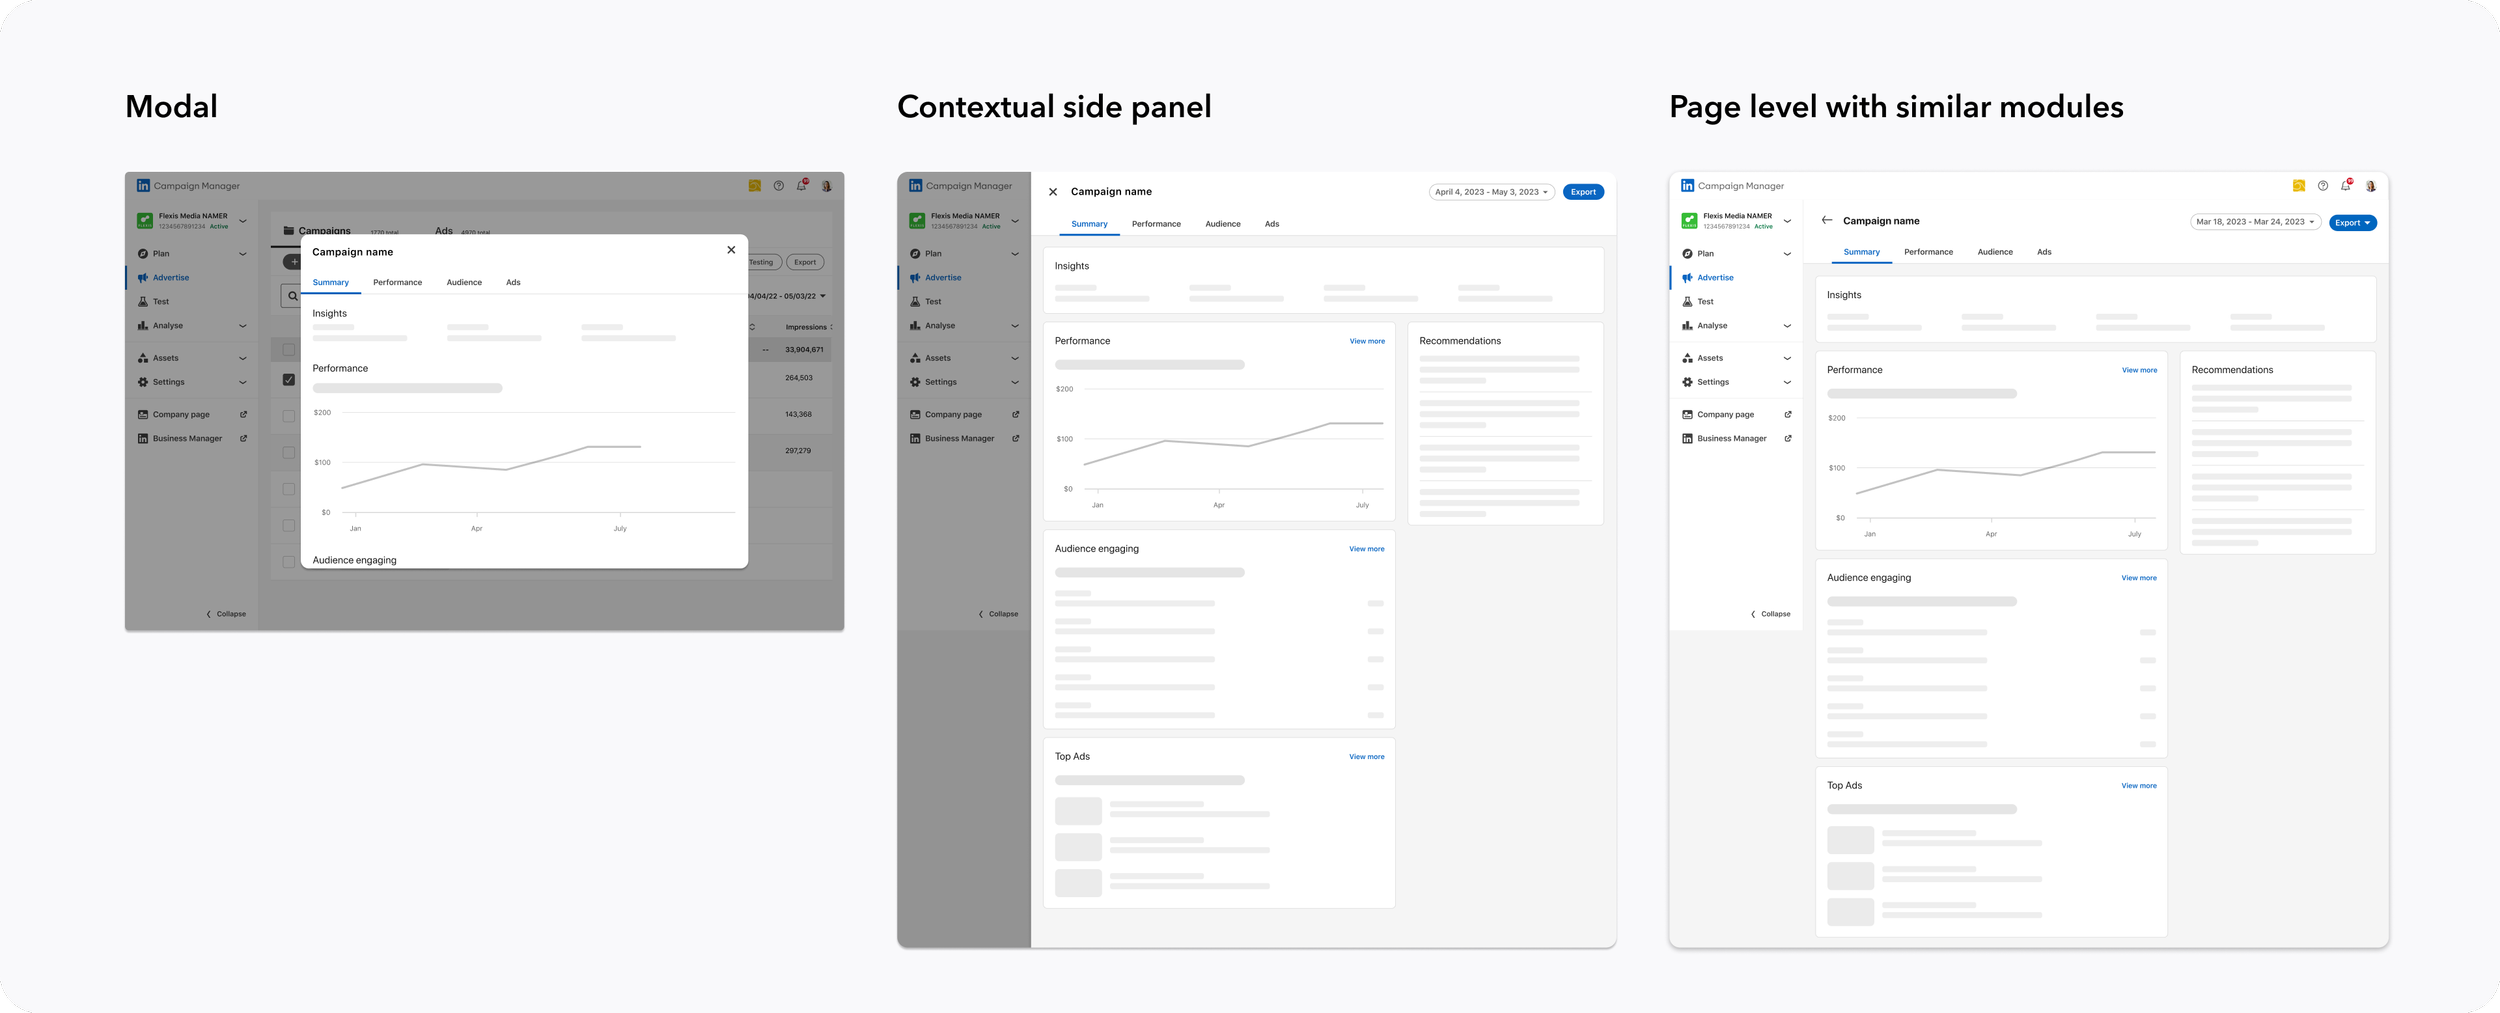
Validated it and shipped in phases
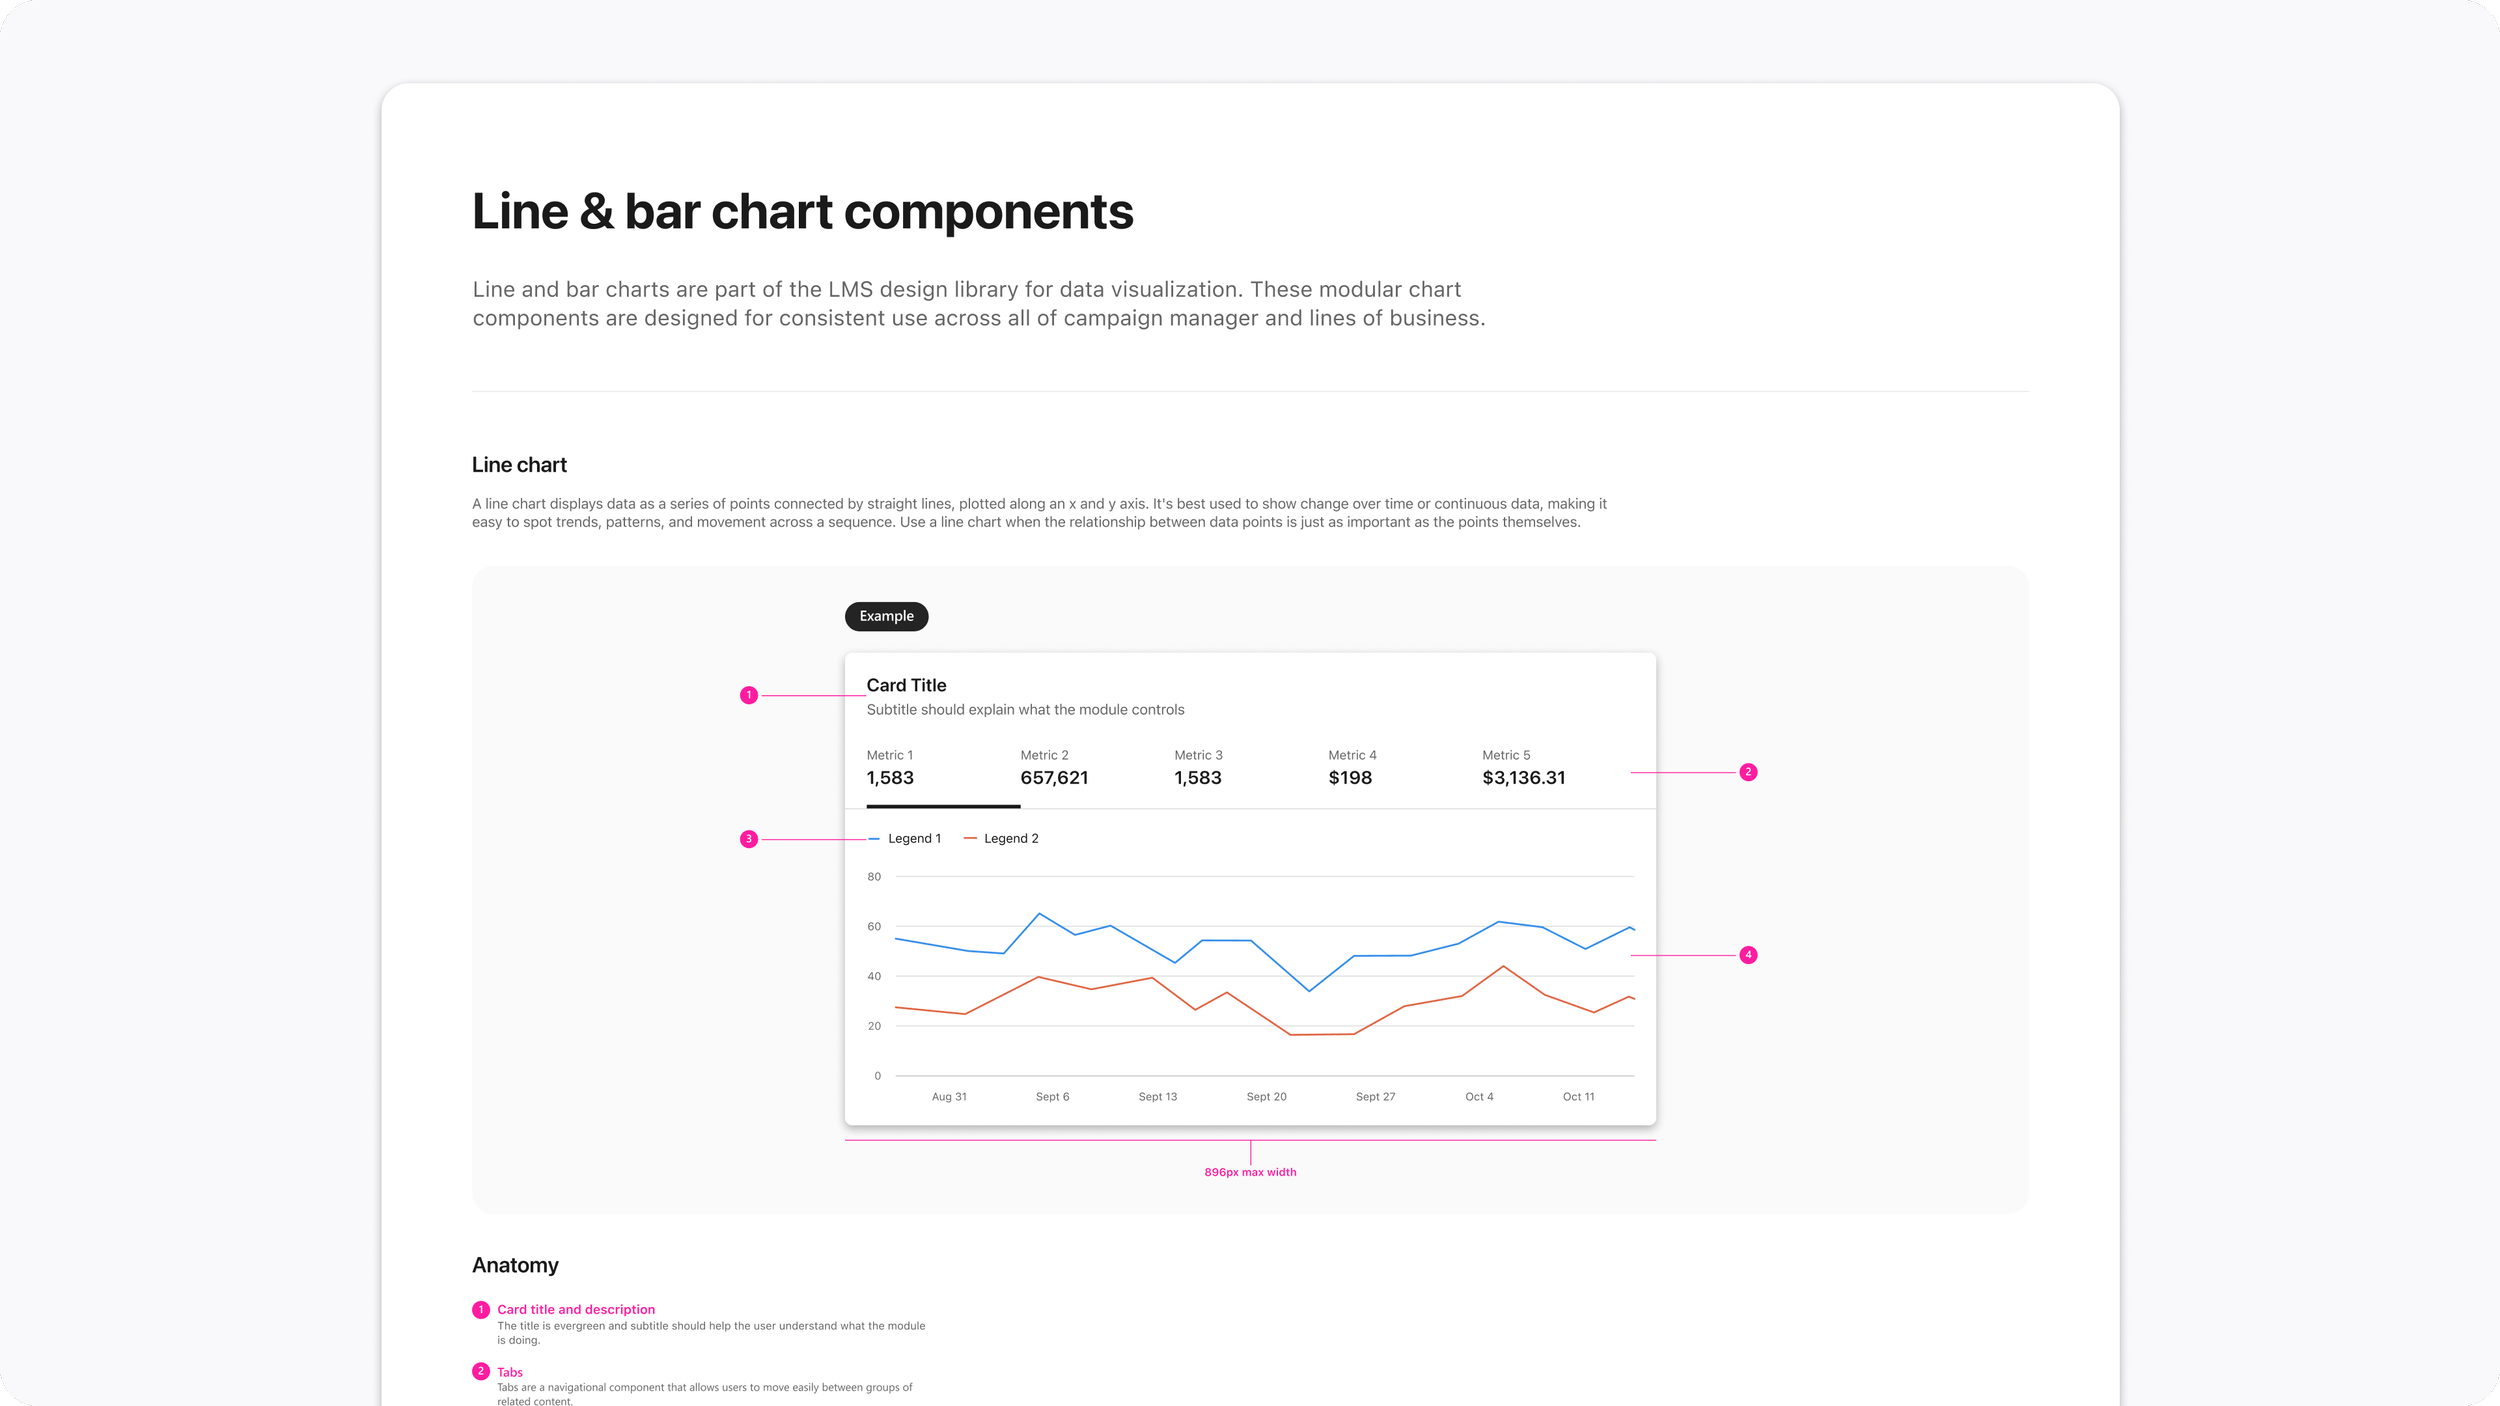
We tested with 12 marketers, who confirmed the structure and told us which metrics mattered most. The B2B chart patterns we needed didn’t exist, so I co-created a data visualization library with the design systems team. Then we released in milestones so each change was small enough to measure.
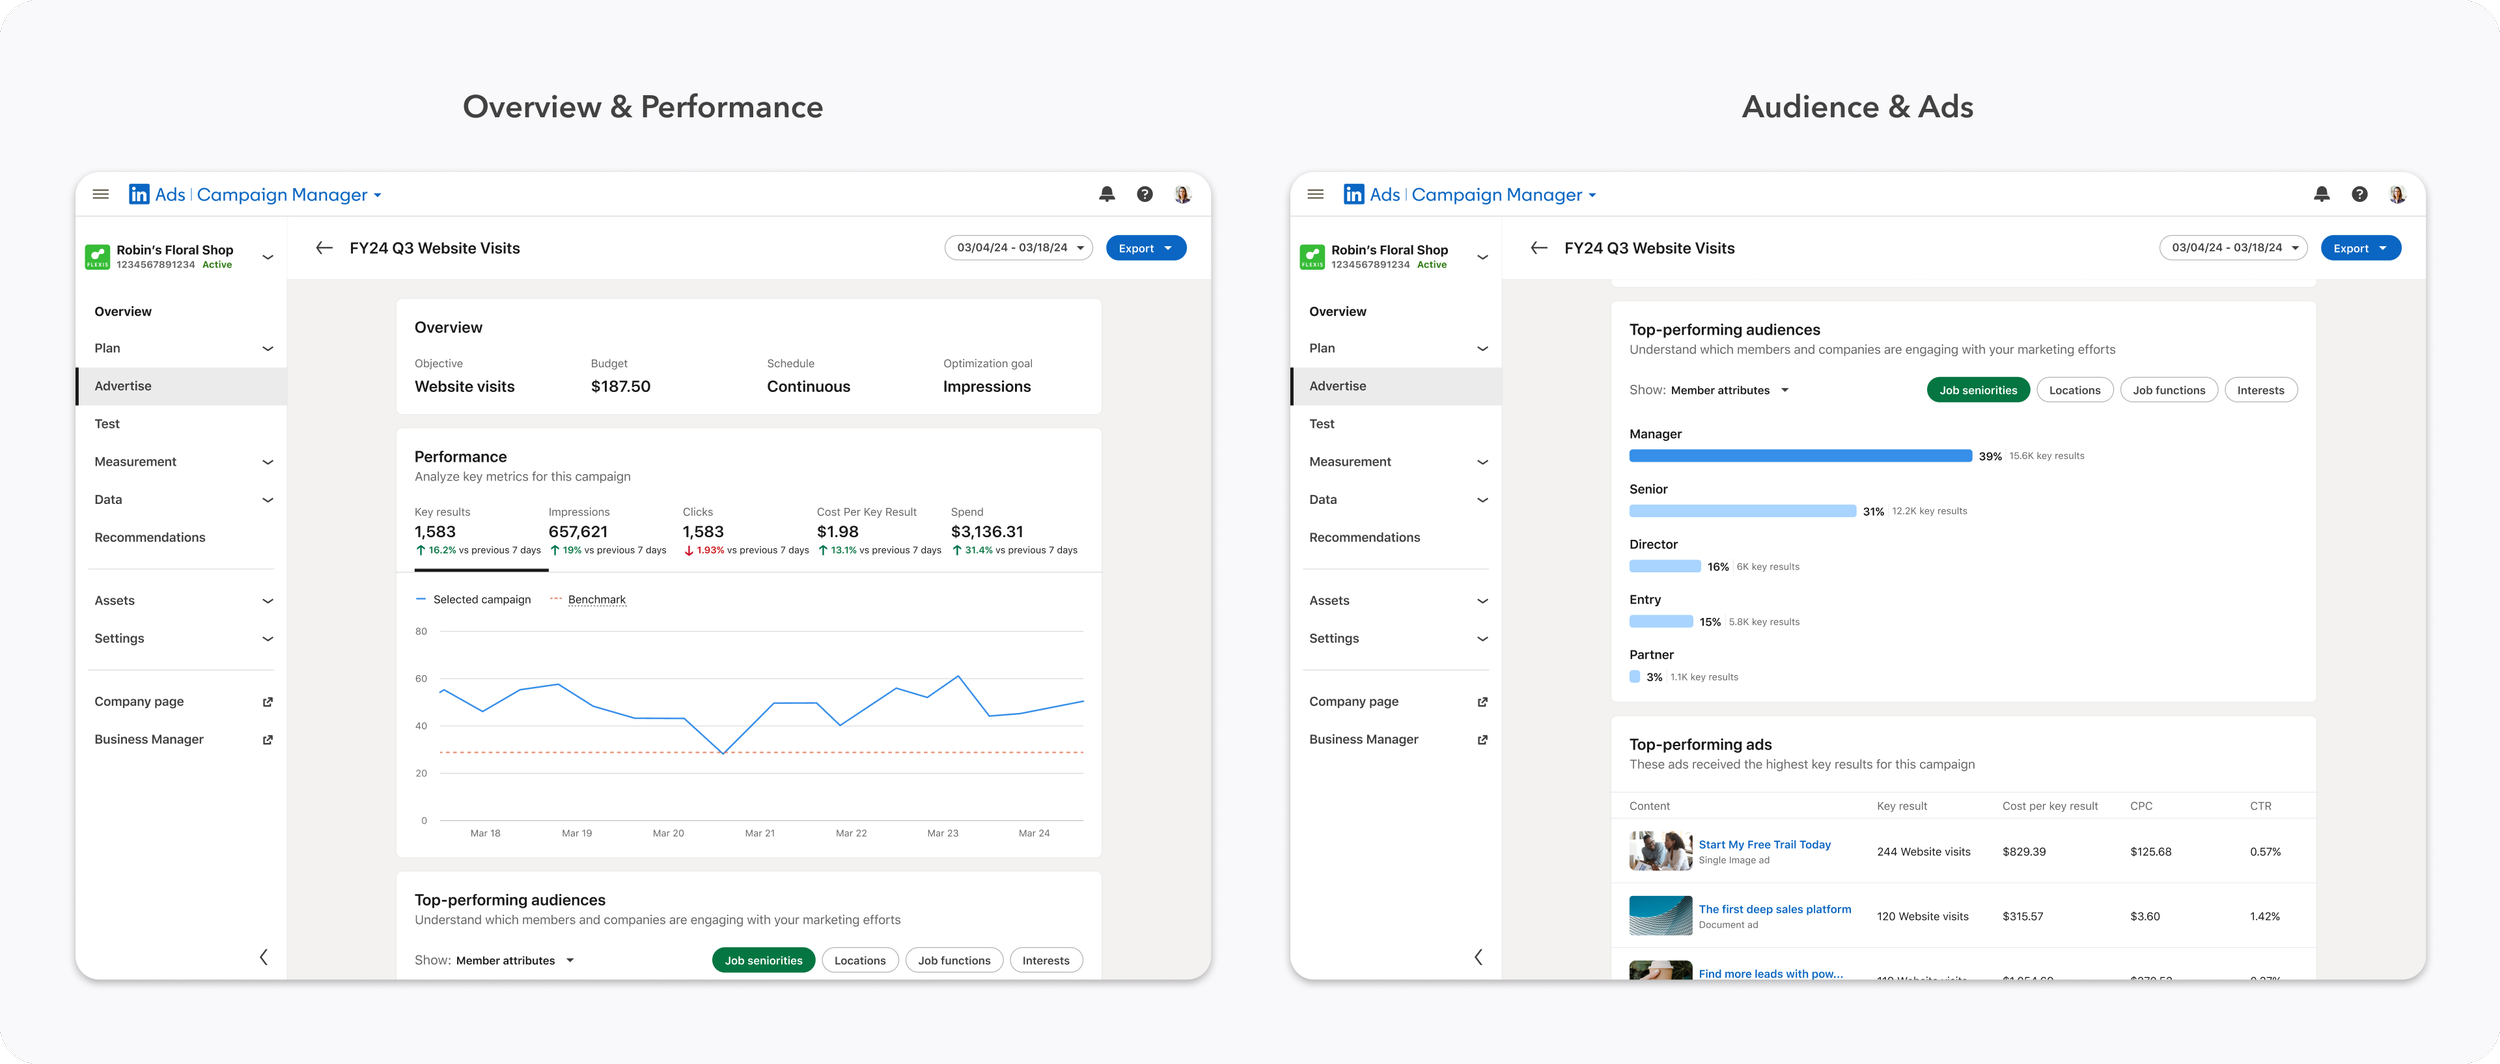
Reflections
Early alignment pays off later. Agreeing with partner teams on the long-term direction early made later decisions faster, and it’s a big reason we could launch with a performance chart at all.
Sometimes the work is building what’s missing. The chart patterns we needed didn’t exist, so designing them became part of the project. With that library in place earlier, I’d have pushed the visual design further.
AI has to earn trust. The AI recommendations I explored were paused while the org set its responsible AI guidelines. Marketers liked the speed but questioned accuracy, so I’d design recommendations that show their reasoning.